Volterra Kernels to Model Nonlinear Aeroelasticity
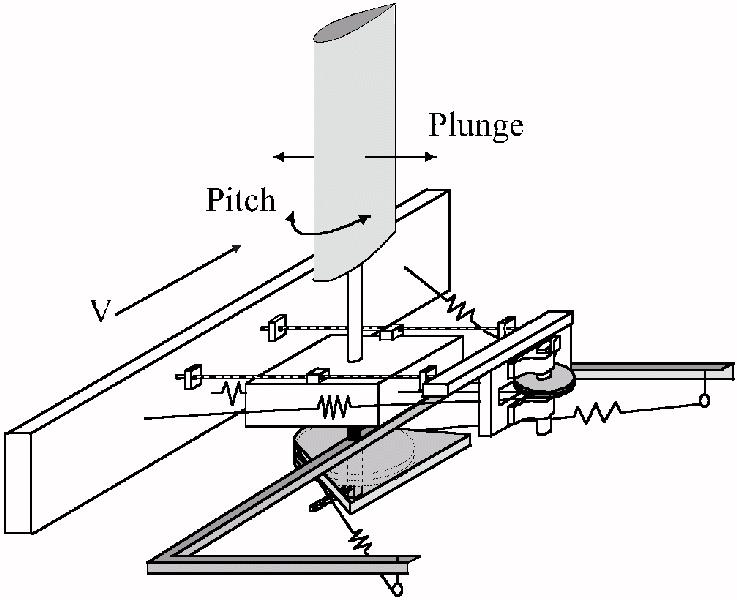
1. Introduction

The analysis of nonlinear aeroelasticity is a research area of increasing importance to the flight test community. The occurence of limit cycle oscillations resulting from these nonlinear dynamics has been noted on several aircraft such as F-16 and F-18. Indeed, these limit cycle oscillations have been noted with varying types of behaviors which may indicate varying nonlinearities affect the dynamics.

Currently limit cycle oscillations can not be predicted with any acceptable level of accuracy or consistency. The majority of research into improving these predictions has been concentrated on computational approaches. The objective with these research projects has been to properly model the equations of motion and correctly generate time-domain solutions using computational simulations. These efforts have been hampered to some extent by a lack of thorough understanding of the nature of the nonlinearities existing in an aircraft.

This project presents a data-based approach to generating nonlinear models that represent the aeroelastic dynamics. The data-based nature of the approach indicates that the nonlinearity is not derived from theoretical assumptions; rather, the nonlinearity is determined from the flight data. This approach is obviously limited in value because the theoretical issues are not solved but the approach still has value for addressing short-term needs of the flight test community.

The estimation of nonlinearity is accomplished using Volterra kernels. Essentially, the approach assumes input and output measurements are available from flight data along with an associated linear model of the dynamics. A nonlinear operator is derived that couples with the linear model such that the resulting closed-loop system describes the flight dynamics. This nonlinear operator is generated as a second-order Volterra kernel.

2. Experimental Testbed

The initial work for this project has been considering a testbed constructed at Texas A&M University under the direction of Professor Thomas Strganac. This testbed, as shown in the photo on the right, is a wing section mounted in a wind tunnel. The section is allowed to move in both pitch and plunge directions. As such, the dynamics of this system are similar in nature to the traditional bending-torsion dynamics associated with aeroelastic flight vehicles.


Nonlinearities are introduced to the dynamics by altering springs and cams on the system. The isometric drawing of the testbed, shown at right, indicates several mechanisms that may be altered. The nonlinearity that will be considered for this study is a nonlinear spring stiffness. Specifically, a hardening spring is included with the pitch degree of freedom. This spring is represented by a 5th-order polynomial and is valid for pitch angles up to 20 deg.


3. Estimating Nonlinearity

The nonlinearity in the pitch-plunge system is estimated by analyzing simulated response data. The simulations will consider responses from a chirp command to the flap. This chirp command ranges from 0.5 to 5.0 Hz over 32 sec. The magnitude of the flap command is 4 deg.

The estimation of the nonlinearity actually uses responses from both the nonlinear dynamics and the linear model. These responses are shown in the figure on the right. Clearly the responses from the linear model and nonlinear system are different. One notable difference is the bias associated with the nonlinear system because of the asymmetric spring stiffness. Another notable difference is the magnitude variations between the linear model and nonlinear system caused by the hardening spring.


The feedback signal, z, is determined by the derivation noted above. This signal is presented in Figure~\ref{fig:diff}.


Volterra kernels are computed to represent a mapping between the signal, z, and the pitch angle. The first-order and second-order kernels are presented in the figures below. The figure on the left shows the first-order kernel is quite small while the figure on the right shows the second-order has a large narrow peak. These results are expected because the kernels are associated with data that is purely nonlinear.


4. Information